EcoService Models Library (ESML)
 Home
Home Search EMs
 My
EMs
My
EMs  Learn about
ESML
Learn about
ESMLVariable Relationship Diagrams
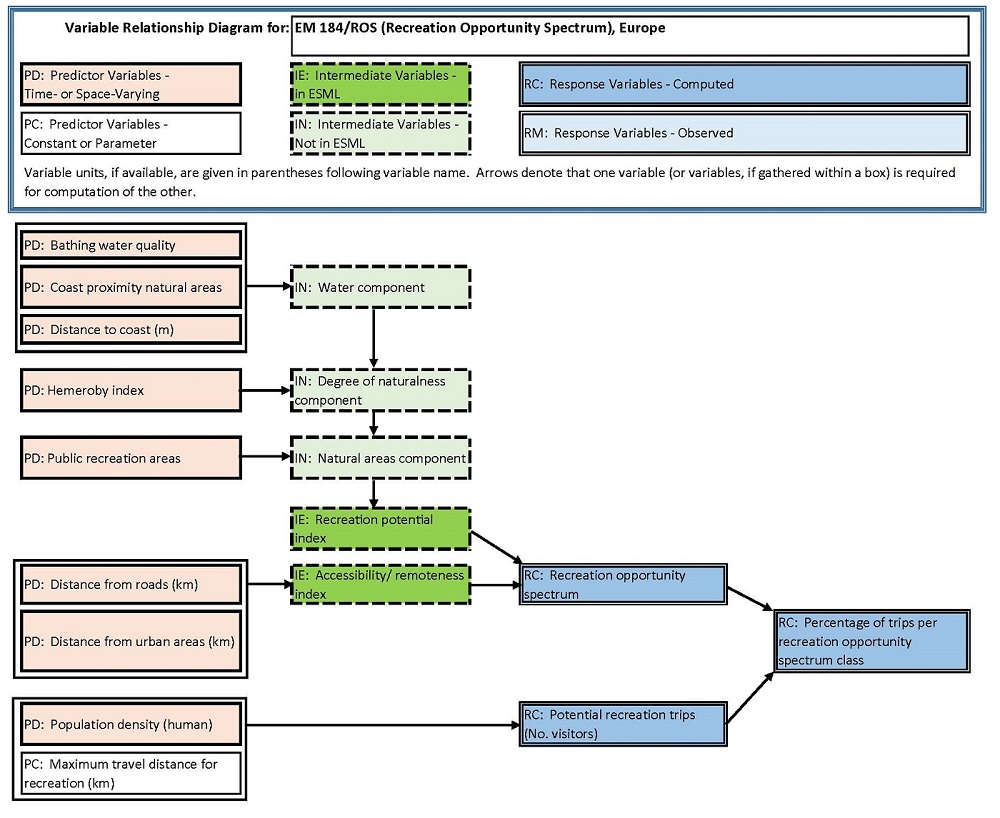
A diagram is prepared for each EM showing the types and interrelationships of its variables. The diagram is labeled with EM ID # and EM Short Name, and each variable is depicted as a box. A two-letter code denotes the variable type. Logic flow is left to right (or down). Arrows denote that one variable (or variables, if gathered within a box) is required for computation of the other.
To improve clarity, complex diagrams may show intermediate variables that were computed by the model but not included in the EM as entered in ESML (since inclusion of each intermediate variable is at the discretion of the enterer). Intermediate variables are coded as IE if entered and IN if not entered.
For predictor variables, an asterisk on the two-letter code indicates that data for multiple runs of this EM are present in ESML, and that the value of the predictor variable so marked differs by run.
The depicted example diagram is for a relatively complex EM. It includes 9 predictor variables (8 Time- or Space-Varying and 17 Constants/Factors). These predictors variously contribute to computation of 5 intermediates (3 which were not entered in ESML and 2 which were entered in ESML) and 3 response variables. Learn more about predictor, intermediate, and response variable roles in ESML.